
No more guessing where numbers come from
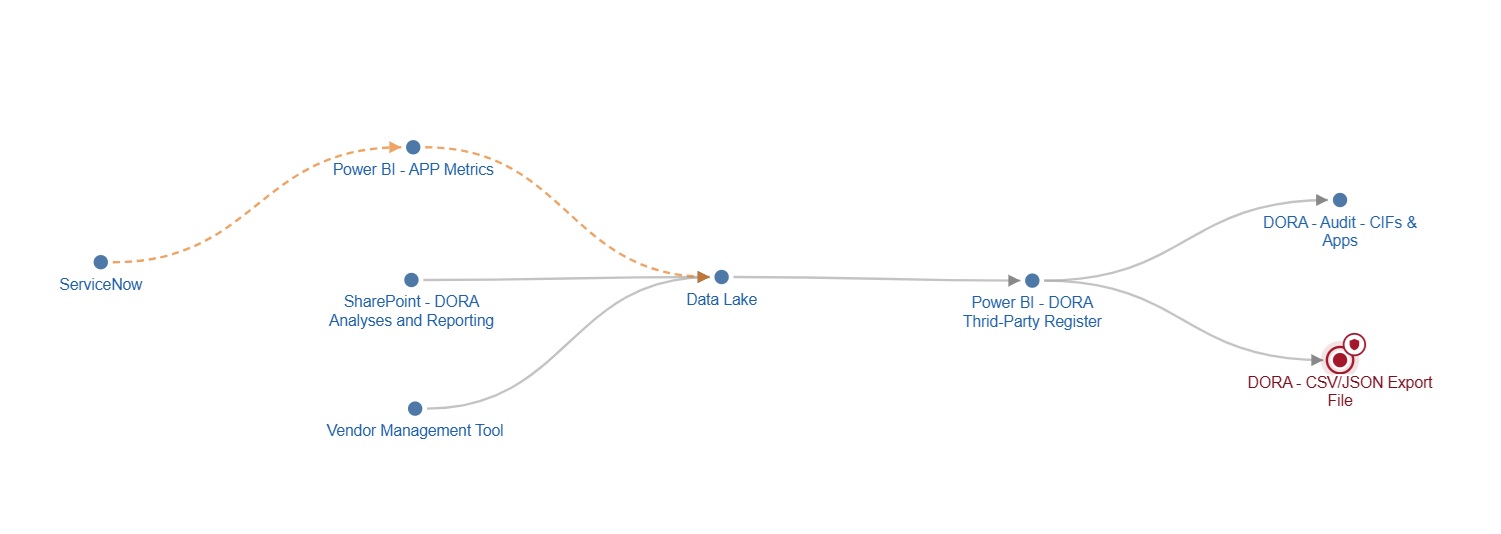
When a figure looks wrong, trace the report upstream through its flows to the source data, instead of asking three teams.
For Business Analysts
You work with the reports, datasets and AI agents the business relies on, not with the code behind them. Asset Navigator traces each report upstream to its source data and downstream to the critical functions it supports, so you can explain a number, scope a requirement and show the business impact of a change.
WHY BUSINESS ANALYSTS USE IT
When a figure looks wrong, trace the report upstream through its flows to the source data, instead of asking three teams.
Before you write a requirement, see which reports, datasets and projects it touches, and which are business or regulatory critical.
One map holds the technical connections and the business attributes: data classification, confidentiality and criticality.
HOW BUSINESS ANALYSTS USE IT
Open a report, application or AI agent and see the critical functions it is linked to, and whether it is business critical or regulatory critical.
Follow each dataset from source to consumer, with its data classification and confidentiality, so you know what the data is and where it really comes from.
See what a project touches and which other projects share the same data, so requirements cover the full impact from the start.
Know which flows and connectors feed your report, so you can ask the right technical team the right question.
See whether a report or dataset runs in test or production before you sign off on its numbers.
Define your critical functions once, then link the reports, datasets and AI agents that support them. When something changes upstream, you see which business functions feel it.
What you get
Explain a number by tracing it to its source, not by chasing teams.
Scope changes with their real upstream and downstream dependencies from the start.
Show which critical functions and reports a change affects, in terms the business understands.
talk to developers and architects using the same picture they work from.
Who it's for
Everyone sees what they need, and acts with confidence.
Understand dependencies before making changes, and see which applications, APIs, databases, datasets or reports are connected.
Read moreSee the potential impact of projects and changes, without relying on individual team members to explain the landscape.
Read moreSee the technical landscape across business units and regions, to spot reuse, avoid duplicate builds and keep new solutions aligned with your architecture.
Read moreSee which assets and AI agents support your critical functions, with their classification, criticality and providers. Export your AI inventory report, ready for your auditor or regulator.
Read more